Bull Put Spread: Complete Beginner's Guide
The bull put spread is a defined-risk, bullish-to-neutral net credit trade that profits when the underlying asset remains above the short put’s strike price by the expiration date. This options strategy offers a lower-cost and lower-risk alternative to selling a put option naked, but the approach also limits potential gains.

The bull put spread options strategy is a net credit trade that involves selling a put and buying another, further out of the money put option. Both puts must have the same expiration and both options are entered in one single trade called a vertical spread. The trade is a low margin way to express a bullish or neutral view without needing a massive move, and risk is capped from the start.
Highlights
- Risk: Limited to the spread width minus the credit received — max loss happens if the stock finishes below the long put strike.
- Reward: Capped at the credit received — max profit happens if the stock stays above the short put.
- Outlook: Moderately bullish or neutral — best when you expect the stock to hold steady or drift higher
- Edge: Works best when IV is high and expected to drop.
- Time Decay: Helps the position — especially as expiration gets closer.
🤔 New to options? It helps immensely to understand both the long put and short put strategies before jumping into spreads.
Bull Put Spread: Trade Components
Here are the basic trade components of a bull put spread:
- Sell 1 put option (closer to the money)
- Buy 1 put option (further out of the money)
- Both options have the same option expiration
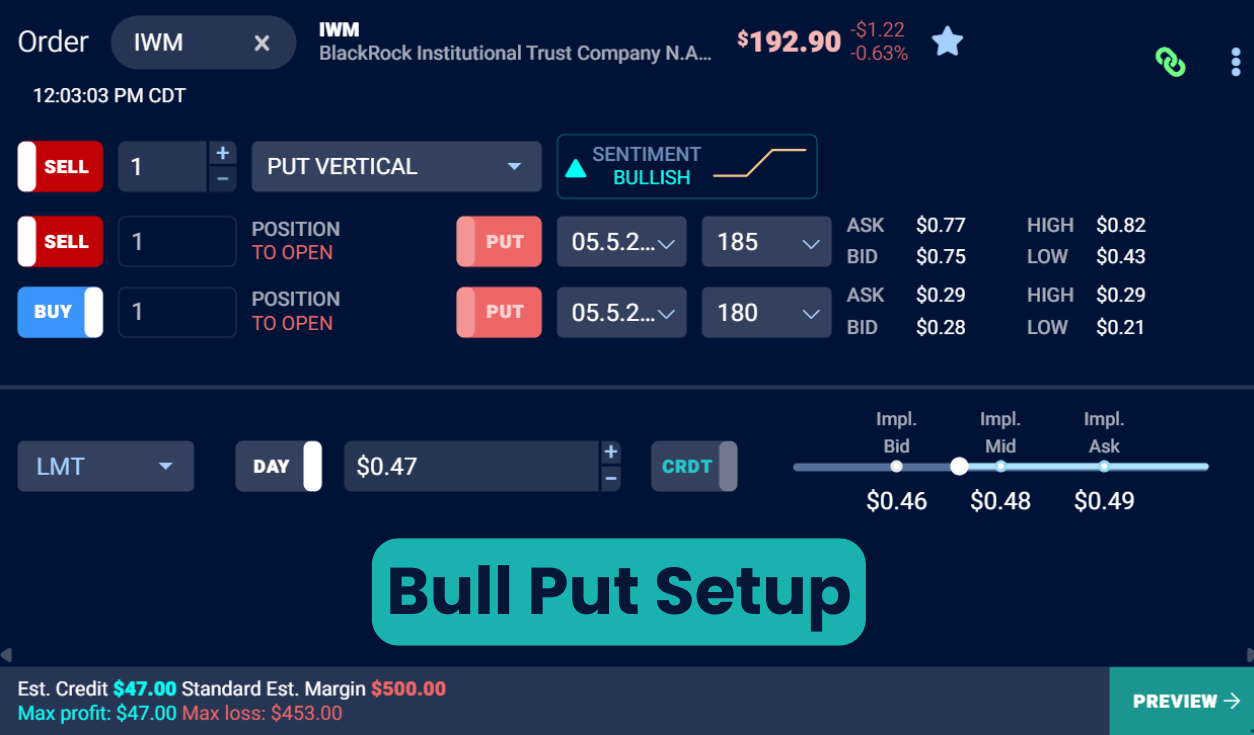
Ideally, you set up the trade in one order, called a "vertical spread." (This is the same structure used for all bull/bear call/put spreads.) You can see the setup displayed below on the TradingBlock dashboard:
Market Outlook: When to Sell a Put Spread
You don’t need a huge upward move to profit from the bull put strategy— a moderate move higher, a flat market, or just a drop in implied volatility can be enough. Here’s when this strategy works best:
- Moderately Bullish Outlook: Because the long put component of the trade limits upside potential, this strategy is great when you expect a moderate move higher. You can sell your short put closer to the money to collect more premium if you’re confident the stock will rally. If you’re exceptionally bullish, you may be better off just buying a long call.
- Market Neutral Outlook: If you think the stock isn’t going anywhere, you may want to sell your put option slightly further out of the money to give yourself some breathing room.
- Elevated IV: Since you’re a net seller of options in this trade, you want to collect as much premium as possible. Rising IV lifts the price of all options, so high IV is an ideal time to put on the trade, e.g., before earnings. Sell a put spread when IV is high, but expected to fall.
Bull Put Spread: Payoff Profile
Let’s walk through the max profit, breakeven, and max loss scenarios for a bull put spread.
Maximum Profit Zone
The max profit on a short vertical put credit spread is simple:
Max Profit = Net Credit Received
For example, let’s say we sold the 100/98 bull put spread on ABC:
- Sell the 100 put
- Buy the 98 put
- Net credit received: $1.00 ($100)
Since we received a $1.00 net credit, that $100 is the most we can make on the trade. We achieve this when ABC trades above $100 at expiration, our short strike price. We can see this below:

Notice that it doesn’t matter how much higher ABC goes. Once it closes above the short put strike price ($100), the entire spread expires worthless, and we keep the full premium.
Breakeven Zone
Breakeven for a bull put spread is when the stock drops just enough to wipe out the premium collected. Here’s the formula:
Breakeven = Short Put Strike – Net Credit Received
For our 100/98 bull put spread example:
- Short Put Strike: $100
- Net Credit: $1.00
Breakeven = $100 – $1.00 = $99.00
That means ABC needs to stay above $99.00 at expiration for us to make money. If it closes exactly at $99.00, the losses on the short put are offset by the premium collected, and the trade finishes flat:

Maximum Loss Zone
As with all vertical credit spreads, the risk is defined upfront. The worst-case scenario happens if ABC falls below the long put strike ($98) at expiration.
Here’s how we calculate it:
Max Loss = Strike Width – Credit Received
For our trade:
- Strike Width: $2.00
- Net Credit: $1.00
- Max Loss: $2.00 – $1.00 = $1.00 ($100)
If ABC closes below $98 at expiration, both puts are in the money, and we take the full $100 loss:

No matter how low ABC falls after that, the loss is capped.
Enough theory - let’s jump over to the TradingBlock platform to check out a real trade!
Trade Example: Short GLD Put Spread
Over the past few months, gold has been on a tear. I believe the commodity will either continue going up, or, at the very least, stay at its current level.
I’m going to therefore sell an out of the money put spread on GLD (SPDR Gold Trust SPDR Gold Shares), an ETF that tracks the price of gold. I chose this ETF for a few reasons:
- Accurate spot tracking of gold
- Decent bid/ask spreads and low slippage
- Numerous strike prices and expirations
GLD is currently trading at $304.48. I’m going to give myself some breathing room just in case i'm wrong, so will be selling a put option approximately 4% out of the money. Note that before I actually place a trade I check several more metrics (implied volatility, theta, delta etc), which we will cover later in this article.
Let’s jump over to the TradingBlock dashboard to find our options:
.png)
Trade Details
- Underlying: GLD
- Expiration: 37 days
- Stock Price: $304.48
- Sell 295 Put: $4.17
- Buy 290 Put: $2.82
- Net Credit: $1.35 (or $135 total)
- Max Profit: $1.35 (or $135 total)
- Max Loss: $5.00 – $1.35 = $3.65 (or $365 total)
- Breakeven Price: $295 – $1.35 = $293.65
So, we sold the 295/290 5-point put spread on GLD for a net credit of $1.35. This means the most we can make is $135, which happens if GLD is trading at $295 or higher on the expiration date. Our max loss here is $365, and occurs if GLD falls to $290 or lower by expiration.
Let’s explore a few different trade outcomes:
GLD: Losing Trade Example
37 days has passed. After the first week or so, GLD rallied hard, causing our short put to shed value rapidly, which is ideal for our trade. But at around the 20 DTE mark, GLD began selling off and never recovered.
Let’s see how our trade played out.
- GLD Price: $304.48 → $287 📉
- Expiration: 37 days → 0
- Sell 295 Put @ $4.17 → $8.00 📈
- Buy 290 Put @ $2.82 → $3.00 📈
- Final Spread Value: $5.00

With the stock at $287 on expiration, both of our puts closed in the money. The amount they were in the money by is their intrinsic value, and is calculated by simply subtracting the stock price from each strike price:
- 295 Put: 295 – 287 = $8.00 intrinsic value
- 290 Put: 290 – 287 = $3.00 intrinsic value
Because it’s a spread, the final spread value is the difference between the two:
- Final Spread Value: 8.00 – 3.00 = $5.00
Since we originally sold the spread for a $1.35 credit, our loss is:
Loss: 5.00 – 1.35 = $3.65 (or $365 total)
GLD: Winning Trade Example
In this outcome, GLD closed well above our short strike price, earning us a maximum profit.
- GLD Price: $304.48 → $315 📈
- Expiration: 37 days → 0
- Sell 295 Put @ $4.17 → $0.00 📉
- Buy 290 Put @ $2.82 → $0.00 📉
- Final Spread Value: $0.00

With the stock at $315 on expiration, both of our puts expired worthless. That’s the best-case scenario for a short put spread — we keep the entire net credit.
Since we collected $1.35 when we opened the trade, that’s exactly what we earned:
- Profit: $1.35 (or $135 total)
Great trade, but notice the value of the short 295 put at around 13 DTE. Assignment risk would have been very high in this window. If we were assigned, we’d be long 100 shares of GLD at $295. If we didn’t want that exposure, we’d have to sell the shares or close the position quickly.
That’s why it often makes sense to close these trades early when the spread value is low and most of the profit is already realized, especially with ITM short options that are nearing expiration.
Choosing Deltas on Bull Put Spreads
In options trading, delta is a key Greek — it tells us how much an option’s price will move with a $1 move in the stock. It also provides a ballpark estimate of the probability that an option will expire in the money.
This is why I always check the deltas before placing any trade. Here's the range I typically look for in a bull put spread:
- Short Put: Delta 0.25–0.45 – Nice premium, less than 50% chance expiring ITM.
- Long Put: Delta 0.10–0.15 – Cheap insurance, far enough OTM.
Bull Put Spreads and Time Decay
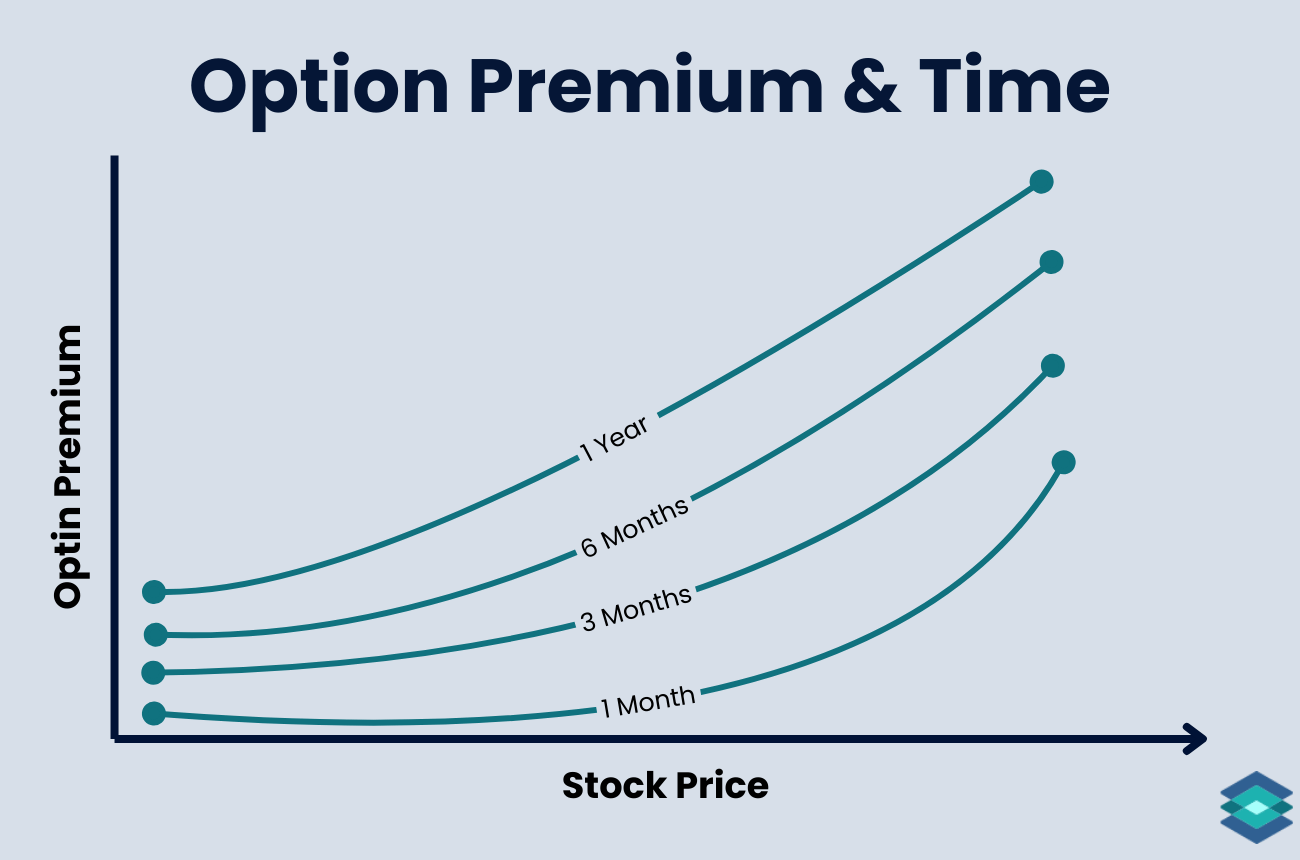
In a stable market—where the underlying isn’t making sharp moves and implied volatility stays steady—option premiums gradually shed value. This steady decay benefits us as net sellers.
The closer you get to expiration, the faster that decay picks up. And since the short put holds more value than the long put, the net effect works in our favor.
.png)
Choosing Theta
Theta is the option Greek that reflects time decay. It tells us how much value the option is expected to lose each day. In bull put srpeads, theta is our best friend because we want our short option to decay as much and as quicikly as possible. Here are a few good theta ranges to look for when setting up your bull put spread:
- Short Put: Theta +0.04 to +0.12 – Main source of time decay.
- Long Put: Theta –0.01 to –0.04 – Minor drag; cheap protection.
- Net Theta: +0.03 to +0.08 – Positive overall, decays in your favor.
Bull Put Spread and Implied Volatility
When trading bull put spreads, implied volatility (IV) plays an important role. Out of the-money puts tend to carry higher IV than at the money options. And since we’re buying the further OTM leg, the trade can be slightly disadvantaged from a volatility standpoint, especially in low IV environments.
With that said, you always want to sell options in high IV environments, typically aiming for at least 30% IV or higher.
To determine if IV is currently elevated for a particular underlying, traders often look at IV Rank, a measure of where today’s IV sits relative to the past year. An IV Rank above 30% is generally considered good for selling premium.
Strike Price and Expiration Selection
Two critical questions to ask yourself before putting on any options trade are:
- How confident am I that the stock will move up, and how far will it move?
- How long am I willing to wait for that move to happen?
Once you have answered these questions, you can start crafting your trade. Let’s begin with selecting the strike price.
Strike Selection
The width of your bull put spread and the credit you collect determine your total risk and reward. Here’s how traders typically think about it:
- Narrow Spread: Lower risk, lower reward. Offers higher probability of profit but smaller potential gain.
- Medium-Width Spread: Balanced trade-off between reward and risk. Good when moderately bullish with some confidence.
- Wide Spread: Higher reward, but also more risk. Use when you’re strongly bullish and expect the stock to stay well above the short put.
Expiration Selection
Bull put spreads are net short premium trades, so you want theta working in your favor. As we said before, time decay starts picking up around 35–45 days to expiration, so that’s the sweet spot I like to target.
That window gives you enough time to let theta grind away, but not so much time that you’re shedding value while waiting for it to kick in. It also gives you room to manage the trade, whether that’s rolling, adjusting, or just closing early if if the trade moves in your favor.
Bull Put Spread: Options Chain
Let’s take everything we just learned and apply it to a real-world options chain on the TradingBlock dashboard. We’re looking at put options on IWM (iShares Russell 2000 ETF) that expire in 43 days.
I’d probably sell the 184/179 put spread. Here’s why:

Managing a Bull Put Spread
Options trading isn’t passive — even with defined-risk trades like bull put spreads, you’ve got to stay engaged. Here are a few trade management tips:
Take Profits Before Expiration
If your spread is nearing max profit, exit it early. Don’t sit around waiting for expiration — if your short put finishes in the money, you could get assigned, forcing you to buy 100 shares of stock. That can tie up a lot of capital fast. Even if both legs are in the money, assignment and exercise fees can add up. Take the win and move on.
Rolling Strike Prices
If your bull put trade is getting away from you, you have several adjustment options:
- Roll the short put lower to reduce risk or extend the trade.
- Roll the long put lower to cut costs if IV drops.
- Roll both legs down if the stock goes against you and you still want to stay in the trade.
Rolling Expirations
If the trade’s going against you and you need more time, you can roll to a later expiration cycle, often in a single 4-way trade. This gives you more time for the stock to turn around and for theta to work in your favor again.
3 Risks of Bull Put Spreads
Thanks to their defined-risk nature, bull put spreads are a relatively low-risk trade — you know your maximum loss right off the bat. But there are a few other risks you should keep in mind:
1. Assignment Risk
The short put portion of the bull put spread carries assignment risk when:
- The option is in the money
- Time to expiration is getting close
- There’s an upcoming dividend
The deeper a put is in the money, the less extrinsic value it holds. That gives the counterparty holding the long put less reason to keep it, and more reason to exercise. This assignment risk ramps up the closer you get to expiration.
If you're short a slightly in the money put with 30 days to expiration (DTE), you're usually fine. But fast forward to the last few days before expiration, and your assignment risk is much higher.
2. Implied Volatility Risk
Bull put spreads are short premium trades. They benefit from higher IV at entry and from falling IV while the trade is open. But if IV rises — especially if the stock moves against you at the same time — the trade can turn ugly fast.
Rising IV is like a rising tide that lifts all option premiums. It inflates the value of both puts in your spread. But since you're net short premium, and your short put is closer to the money, it usually gains value faster than your long put. That means the spread widens, and your losses grow.
This can happen even if the stock isn’t moving much. Volatility risk typically spikes ahead of major news events, such as earnings reports, economic releases, or geopolitical shocks.
3. Liquidity Risk
Options on thinly traded stocks or ETFs can have very illiquid markets. Signs of low liquidity include:
- Wide bid/ask spreads
- Low open interest
- Low trading volume
If you’re trading illiquid strikes, getting in and out at a decent price can be a challenge, especially if volatility picks up and the spreads widen even more. Always check liquidity before entering a trade. Read our dedicated article on option liquidity here to learn more.
Bull Put Spreads and The Greeks
In options trading, the Greeks are a set of risk metrics that help estimate how an option’s price will respond to changes in key market variables. Here are the five most important Greeks to know:
- Delta – Measures how much the option price moves relative to the underlying stock.
- Gamma – Tracks how Delta changes as the stock moves.
- Theta – Measures time decay, showing how much value the option loses daily.
- Vega – Sensitivity to implied volatility, affecting option price.
- Rho – Measures the impact of interest rate changes on the option price.
And here is the relationship between bull put spreads and these Greeks:
Vertical Spread Calculator
Check out our vertical spread calculator here to visualize how bull put spreads perform under different markets, conditions, and times.
.png)
⚠️Bull put spreads involve defined risk, but they still require a clear understanding of how options work. This strategy may not be suitable for all investors. Commissions, fees, and slippage can significantly impact trade outcomes, none of which are reflected in the examples above. Read The Characteristics and Risks of Standardized Options before trading options.
.svg)
.svg)
.svg)
.svg)
.svg)
.svg)
FAQ
A great strategy for a bull put spread is to sell your short put strike about 5% out of the money when implied volatility is elevated. This gives you a good balance between premium collected and probability of profit — especially if you expect the stock to hold steady or rise higher.
The bull put spread is best used when you have a neutral to moderately bullish outlook and want to take advantage of high IV and time decay. The bull call spread is better suited for when you expect a strong upward move and want to benefit from directional price action with a defined-cost trade.
Some risks of a bull put spread include:
- Assignment risk if your short put moves in the money near expiration
- Liquidity risk when trading thinly traded options
- Implied volatility risk, especially if IV rises while the stock drops
As a rule of thumb, it’s smart to exit a bull put spread once you've captured 80% of your max profit, or if assignment risk becomes high as expiration nears.
You can let your bull put spread expire worthless only if both legs are safely out of the money. If the short put is near the money at expiration, your best move is to buy it back to avoid assignment and let the long put expire worthless.
A bear put spread (net debit trade) is bearish, while a bull put spread (net credit trade) is bullish.
The short put strategy is bullish to neutral. It profits when the stock stays above the strike price—either rising or remaining flat.